In 2016, the 15-state American South contributed a record $6.12 trillion (that’s with a “T”) to the United States’ economy, which saw a GDP totaling $18.57 trillion. The West contributed $4.61 trillion, which was more than any other region. Take California out of the West, and its GDP totals a mere $2 trillion.
In fact, the U.S. economy remains the largest in the world by a wide margin. China, the second largest economy on the planet, generated a GDP of $11.2 trillion in 2016 in U.S. dollars, according to the World Bank, and that means something. Last year, 64 percent of all transactions world-wide were traded in dollars. Still, the dollar reigns supreme of all known central bank foreign exchange reserves.
No other country’s currency — even multi-country currencies — comes close in transactions (the Euro is second at 19.7 percent.) Which means that although we may not be the best savers — as a nation and as citizens — no international body in its right mind would challenge U.S. debt. Not now, anyway.
The new “gross regional product” numbers for 2016 mean that the South’s economy is more than half the size of China’s. Pretty dang impressive.
There are several ways the South has accomplished this incredible feat seen in 2016. It has diversified its economic base like no time ever. Its in-migration from other U.S. regions is back to levels not seen since the 1980s, 1990s and before the Great Recession. Well-educated immigrants from other countries now want to live in the South as opposed to other regions because the South remains the least expensive place in the world’s largest economy to live and operate a business.
Furthermore, the South is unlike any of the other three regions in demography. No U.S. region has the number of mid-major markets the South has — Austin, San Antonio, Raleigh, Charlotte, Nashville, Orlando, New Orleans, Richmond, Birmingham, Louisville, Greenville and so many others. Sure, we are home to mega-markets such as Atlanta, Dallas-Fort
Worth, Houston, South Florida and D.C. But it is the vast number of mid-majors that solidify the South’s economy and help spread the wealth.
Want proof? Name a major market in Illinois other than Chicago? Name one in New York? Florida and Texas have 10 mid-majors each.
So, here is a new trophy earned by the American South. New data from the World Bank shows that the region’s 2016 GRP has forced us to make a change to our masthead. The South is no longer the fourth largest economy in the world. GDP and GRP data shows that the American South is now the third largest economy in the world with $6.12 trillion in GDP churned in 2016. For almost two decades, our masthead read, “Economic Development in the World’s Fourth Largest Economy.” Not anymore. The South is No. 3 in the world!
Here are the top 10 economies in the world, with regions of the U.S. factored in when it comes to GDP in 2016. The values are based on U.S. dollars:
I’ll believe North Carolina will land the Toyota-Mazda Big Kahuna when they write the check
By Michael Randle, EDITOR
Some are saying that North Carolina is the front-runner for Toyota and Mazda’s proposed $1.6 billion, 4,000-employee plant that the Japanese automakers are shopping around the U.S. The advantages are numerous for the Tar Heel State, sources say. They cite four excellent megasites in the state — two in Chatham County near the Research Triangle, one in Randolph County near Greensboro and another in Edgecombe County near Rocky Mount. North Carolina also has one of the largest workforces in the South in an age of very tight labor.
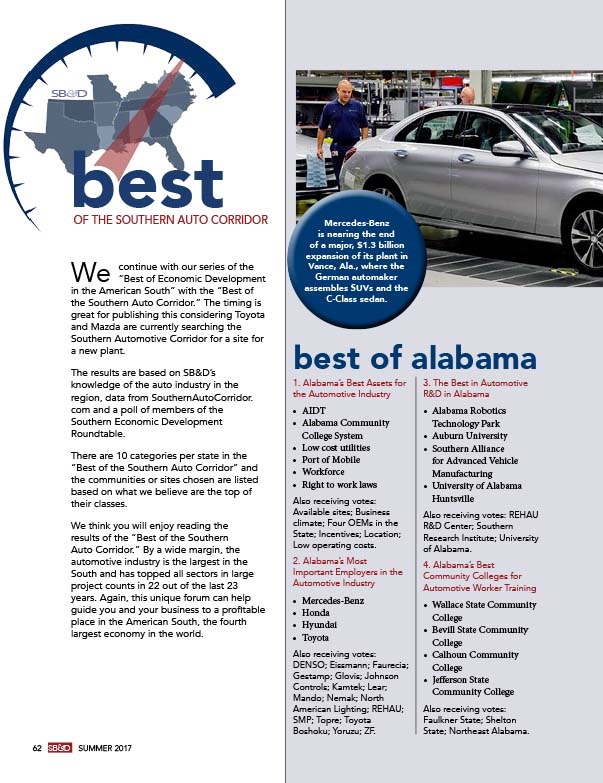
Also weighing in North Carolina’s favor, some sources say, is the fact that the state is not currently home to what we call a “Big Kahuna,” or a major automotive assembly plant. Plain and simple, automotive plants are the Big Kahuna in economic development. No projects have the economic effect that an automotive plant has on a state, multi-county region or a city. Simply put, they are the largest drivers of wages in the South. In 22 of the last 23 years, the automotive industry has led all sectors in the region — services or manufacturing — in large projects of 200 jobs or more.
Arkansas, Florida, Louisiana, North Carolina, Oklahoma and Virginia are the only states left in the South that are not home to at least one major automotive assembly plant. Louisiana and Oklahoma were home to GM plants, but those closed in the last 12 years.
Of those states void of a major automotive assembly plant, North Carolina and Virginia would be ranked No. 1 and No. 2 in the prospect of landing one in the Southern Automotive Corridor. After all, North Carolina was a finalist for the Toyota plant that ended up in Blue Springs, Miss., in 2007. The state was also a finalist for the Mercedes-Benz plant that announced in Alabama in 1993. In both cases, North Carolina was outbid badly by Mississippi and Alabama when it came to the incentive packages offered.
Just like those two projects, North Carolina will have to pony up for the Toyota and Mazda joint venture, unlike it has ever done for a large job generating deal. The largest incentive package I can recall that North Carolina has doled out over the last 25 years was to Dell when it opened a computer factory in Winston-Salem in 2005. That package totaled over $200 million. However, Dell didn’t even get a whiff of a large portion of that $200-plus million. The plant closed four years after opening and most of the incentives paid to Dell were returned to state and local agencies via claw back provisions.
North Carolina has written into its state budgets this year and next up to $50 million in incentives toward a “transformative” project. According to the provision, that amount could be offered by the state for a project of $4 billion in capital investment and a 5,000-employee commitment. Let me tell you, it’s going to take a lot more than $50 million to land this latest Big Kahuna. In fact, it might take $500 million to land the project, which will be the most efficient automotive factory in the world using artificial intelligence and connectivity to build automobiles. Toyota will most likely make electric Corolla models and Mazda will make electric SUVs at the proposed plant.
Other than the aforementioned sites in North Carolina, we’ve heard Toyota officials have already looked at the Glendale Megasite in Hardin County, Ky; the Huntsville Megasite in Limestone County, Ala.; and the Memphis Megasite in Haywood County, Tenn. It should be noted that in addition to Toyota’s plant in Mississippi, the automaker has an engine plant in Huntsville, Ala., and its largest U.S. plant in Georgetown, Ky. Again, in an age of very tight labor, let’s not forget there are thousands of out-of-work coal miners in Eastern Kentucky.
There have been nine new foreign-owned automotive plants built in the Southern Automotive Corridor since Mercedes announced it was building its Alabama plant in 1993. Right up to the day before that transformational Alabama project, The Wall Street Journal had picked a site in Mebane, N.C., as the site for the German automaker.
After decades of being the bridesmaid in auto assembly announcements, this Toyota-Mazda site search could actually end up in North Carolina. But I will believe it when I see North Carolina write the check for this latest Big Kahuna.
Real answers about the South’s economy in a post-truth, “alternative facts” age.
By Michael C. Randle
“We are in the second-longest economic expansion in U.S. history.” Source: Left-leaning media
In a post-truth, alternative facts, fake news world, brought about almost exclusively by the far-left and far-right media, as well as political officials on the fringe, what are we supposed to believe? What we can trust is the data. So, let’s look at the data that busts some of the myths that are out there now in an effort to find the truth about the current economy.
Quarterly economic data from the federal government did not exist until after World War II. Therefore, it is difficult to trust sources prior to then when it comes to economic expansions or recessions.
Based on the data, an economic expansion is defined as a measure of economic growth from one quarter to another. It is essentially the rate of change in the nation’s gross domestic product. Some measure the growth or decline of an economy from one year to the next, but mostly, it is factored quarterly.
If GDP grows each quarter — the current economy has expanded for 31 consecutive quarters, or almost eight years — that is considered an expansion. A recession is defined by the federal government and economists as a decline in real GDP, income, employment, retail sales and manufacturing for at least two quarters, or six months. That has not occurred with the nation’s economy since the first and second quarters of 2009.
The current economic expansion is very impressive, but it is not the second-longest in U.S. history, or even the second-longest post-World War II. The nation’s economic expansion from the first quarter of 1961 to the fourth quarter of 1969 lasted 36 quarters, according to the U.S. Department of Commerce. That was the second-longest expansion in U.S. history.
The nation’s economy advanced by 32 consecutive quarters from 1982 to 1990, making it the third-longest expansion. And the expansion of the go-go 1990s from 1991 to 2001 lasted 38 quarters, or nine and a half years, the longest economic expansion ever recorded.
Regardless, this current economy is in rarefied air, and no one who has the data can call it a recession as we have heard from some far-right news sources. One more quarter of an advancing economy and we will have tied the third-longest expanded economy.
And the data says: The length of the current economic expansion is not the second-longest in U.S. history. It is the fourth-longest in the nation’s history (or since quarterly GDP numbers were first calculated in 1949).
“Workforce participation rates today are the worst in U.S. history.” Source: Right-leaning media
Workforce participation rates are not great, they are average, which is really not the problem. The real problem is most who claim the quote above, or anything like it, don’t even know the definition of “workforce participation.”
“Workforce participation rate” is defined as the percentage of people from age 16 to 64 years old, either holding a job or actively seeking work. High school and college students who do not have a job are deemed “not participating.” Retirees in nursing homes are considered “not participating.” The disabled are considered “not participating.” Stay-at-home persons who can’t afford childcare or elder care are considered “not participating.” I’m sure there is a kid somewhere who is 16 years old, driving his Camaro to junior high because he failed the ninth grade twice. Yes, that kid is considered “not participating” in the workforce.
Also, the severely addicted, if not working or seeking a job, are considered “not participating,” as are the mentally ill, which should be addressed when discussing workforce participation, or lack thereof.
Arguably, one of the reasons the workforce participation rate is just average at 63 percent is that back in the 1990s when it was so high (67 percent), there were very few drug tests taken when applying for a job. Today, drug tests are almost mandatory due to insurance regulations.
Drug use is part of the reason many people don’t participate in the workforce. There is more illegal drug use in this country than ever before, which has been documented by many sources. That’s a big portion of the work-eligible, participation problem. What’s the point in applying for a job, when many think, “I won’t pass the drug test.”
There is no question that drug tests administered when applying for a job are keeping workers on the sidelines. So, it is a little unfair to compare workforce participation rates today to the days when drug tests were rarely if ever given.
Since 1970, the highest workforce participation rate was in March 2000 at 67.3 percent of eligible workers with a job or seeking one. Today, the workforce participation rate is right at 63 percent. For the year 1970, the labor participation rate was 60.4 percent. At no time since has it ever risen above 67.3 percent.
And the data says: At 63 percent, workforce participation rates today are not the worst in U.S. history. Since 1970, we’ve seen workforce participation rates drop to 60.4 percent, and the highest ever was 67.3 percent. So, workforce participation rates today are a little below average the rates seen since 1970.
It should also be noted that over the last 18 months, the civilian labor force climbed nearly 2 percent, a very strong pace. That growth came from workers reentering the workforce. And the prime-age workforce participation rate (ages 25 to 54 years) has surged to 82 percent, the highest in nearly three years.
“Wages have grown faster over the past few years than at any time in history.” Source: President Obama made this claim in a memo to the American people right before he left office
Since 1960, annual wage growth or decline has bounced from its highest at 13.77 percent to a low of minus 5.77 percent. In recent recoveries like the one we are in now, wages on average grew by about 3.7 percent per year. According to the Bureau of Labor Statistics, wage growth in the U.S. averaged 6.29 percent from 1960 to 2016. But that average counted many years in the 1960s of fast-rising wages, and in the 1970s of spiking inflation.
In the last three decades, wages have not come close to growing by the 6.29 percent annual average, particularly post-Great Recession. In fact, average hourly wages grew by only 2.9 percent in 2016, and that was one of the best years in a decade. Wages grew by 2.3 percent in 2015, and 2.1 percent in 2014. If hourly wages had grown by 3.7 percent in 2016, the average during recoveries, workers would be making nearly $30 an hour compared to the $26 average today.
However, in former President Obama’s defense regarding his claim, the median household income grew to $56,500 in 2015 (adjusted for inflation), according to the U.S. Census Bureau. That’s growth of more than 5 percent in real median household income.
That 5 percent gain is the largest annual increase in income since median household income data has been recorded, which began in 1968. . .which is probably what Obama was referring to.
And the data says: Wages have not grown faster over the past few years than at any time in the past 40 years. President Obama was wrong.
“There have been 77 consecutive months (as of February 2017) of job growth in the U.S., a modern-day record.” Source: All kinds of media that lean left, several that lean right and the Bureau of Labor Statistic
Under President Obama’s watch, at least 2 million jobs were created in each of his last six years in office. During that time, the U.S. set a record for the most consecutive months of creating 200,000 jobs or more. Under Obama, the U.S. created 2.2 million new jobs in 2016 and 2.7 million in 2015.
On the other hand, Obama’s administration claimed that more than 15 million jobs were created in that administration. That’s a gross figure, which they failed to point out. Remember, the Obama administration began in January 2009. At that time and until 2010 (the first full year of recovery), the U.S. was bleeding hundreds of thousands of jobs monthly. That being the case, Obama’s net job creation total was 11.3 million jobs.
That total was still much better than President George W. Bush’s two terms, which saw only 2.3 million net new jobs created. But Obama’s net jobs figure did not compare to Ronald Reagan’s two terms (15.9 million net jobs) or Bill Clinton’s two terms (22.9 million net jobs).
And the data says: True, the 77 consecutive months of job growth in the U.S. under the Obama and Trump administrations is indeed a modern-day record.
In the recent presidential election, Donald Trump said in the final debate, “We don’t make our product anymore. It’s very sad.” He then said, “We’ve given up.”
We did give up in the 1990s, when those comments by President Trump would have been applicable. Back then we simply could not compete in the manufacturing arena with China. Today, we compete very favorably with every country in the world, including China and Mexico, for new and expanded manufacturing industries.
In an article published by CNN Money in the fall 2016 quarter, Chad Moutray, chief economist with the National Association of Manufacturers, was quoted saying, “We produce more today than we ever have. We made $2.1 trillion worth of products in 2015.” In fact, in the first quarter of 2016, the value of products made in America reached a record high. Which means that we are experiencing the most productive period in manufacturing history in this country.
“We don’t make things anymore.” Source: President Trump while campaigning
Today, U.S.-based factories — both foreign-owned and domestic — are making almost five times more product than in the 1950s and ’60s, and they are doing it with many less workers. That’s where people can get confused about the manufacturing sector and its performance in the U.S. The job losses are important, but misleading.
In 1979, manufacturing employment peaked at 19.6 million workers. Today that figure is about 12.4 million and it has stabilized. In fact, over the last six years, the U.S. has created net new manufacturing jobs for the first time in more than two decades. Since the end of the recession, the U.S. manufacturing sector has added more than 800,000 jobs, with about 40 percent of those in the South. And compared to 1960 when one in four Americans had a job in manufacturing, today only one in 10 work in the sector.
The best way to understand advanced manufacturing today is to look at the history of the farm workforce in the U.S. In 1880, roughly 50 percent of Americans worked on a farm. Today, that figure is below 2 percent. The reason is the same reason jobs have been lost in the manufacturing sector; automation on the farm and on the factory floor have reduced both workforces.
And the data says: In the first quarter of 2016, the value of products made in America reached a record high. Today, U.S.-based factories — both foreign-owned and domestic — are making almost five times more product than in the 1950s and ’60s. The real issue is that the nation’s manufacturing sector is making more today than ever with about 60 percent of the peak manufacturing workforce of 1979. Yes, we have lost millions of manufacturing jobs, primarily to automation, but President Trump is wrong. The U.S. manufacturing sector makes more products than ever.
“The current federal minimum wage is a starvation wage. It’s got to be raised to a living wage.” Source: Sen. Bernie Sanders
When campaigning for the Democratic nomination for president, Sen. Bernie Sanders introduced a bill that would raise the federal minimum wage to $15 an hour. This is not a black-and-white argument that can be fact checked like the previous statements simply because the minimum federal wage hasn’t been raised to $15 an hour, or even to $8 an hour, so it’s impossible to make a definitive statement on right or wrong based on its effect on the economy. It is more of a gray area that needs to be discussed among unbiased, nonpartisan minds.
There isn’t any question that Sanders is right when he said “the federal minimum wage” of $7.25 an hour is “a starvation wage.” You would have to be far right of the Tea Party if you believe that $7.25 an hour is a fair wage. It hasn’t increased since July 2009. There is no question that it needs to be raised. However, an across-the-board advancement of the federal minimum wage from $7.25 to $15 an hour would make some areas of the nation incredibly vulnerable, and place those areas in noncompetitive positions.
Wages are the most important aspect of any economy in my opinion. When it comes to the practice of economic development, wages are the only thing the vast majority of people — outside of economic developers and economists — truly understand. The economic development community tries to explain to elected officials, business leaders, local and statewide media as well as the citizenry at large, why a job-generating project is so important to a community and why incentives to capture that project are so critical. But they do a very poor job in their explanations.
In an age of “corporate welfare” accusations when it comes to incentives, simplifying the return on investment of a job generating project can be very effective. At the moment I am writing this article, some politicos in Florida want to abolish Enterprise Florida, the only statewide economic organization in the state. It has come to this because the economic development community in the state cannot seem to argue the merits of Enterprise Florida and the incentives the organization hands out to new and expanding business and industry.
Again, few people outside of it understand the practice of economic development — tax generation, multipliers and revenue streams that come from a job- and investment-generating project. And if an elected official’s proposed incentive is based on tax generation, then those outside of economic development would simply say to themselves, “I don’t trust them with that money, either.”
However, wages are something that everyone understands, because most everyone earns a wage. Wages go directly to the people and not first to the government. I often tell people who are charged with explaining how economic development works to focus on the wages a single project will inject into a community.
For example, the BMW plant in South Carolina generates about $700 million in wages for the Upstate region each year, not including the automaker’s suppliers. Count suppliers, and the wages are upwards of $1.7 billion a year for a single project. The plant has been operating since 1994, and it will continue to roll out SUVs for many years to come, meaning the incentives paid to BMW are a pittance compared to the wages generated over the course of, say, the 75-year lifespan of the plant.
I remember when a far-right think tank from North Carolina accused me in 2003 of being a fiscal liberal because of my support of incentives. I told the far-right editor who was interviewing me that Alabama has spent less than $2 billion in incentives to three automotive assembly plants — Mercedes-Benz, Honda and Hyundai — since 1993. The wages paid at just those three assembly plants are today right at $20 billion dollars. Those wages don’t count the hundreds of suppliers the three facilities have drawn to Alabama. So far, Alabama has enjoyed more than ten times its return on investment in wages alone!
The editor of the far-right think tank would have none of it. He said, “I think all ‘corporate welfare’ should be directed to education and public safety.” I said to him, “Well, if you do that, North Carolina will be the safest, smartest, 20 percent unemployment state in the South.”
But back to Bernie Sanders and his recent quest to advance the federal minimum wage to $15 an hour all across America. I think everyone would support higher wages for all if, of course, it didn’t come at the expense of someone else’s pocketbook. Obviously, that is not possible.
A $15 wage increase across the nation is ludicrous. Sanders wanted to raise the federal minimum wage the same amount for New York City, San Francisco and Los Angeles as with Martinsville, Va., Monroeville, Ala., and Alexandria, La? That makes absolutely no sense.
If you raised the minimum wage in those last three areas to $15 an hour, they couldn’t compete, and while not all three are considered “rural,” the rural South and much of rural America would immediately lose any competitiveness they now have because the wages would be too high for employers. The rural South is competitive for cost reasons and natural resource-based reasons only in today’s economy. Take out the cost advantage from the rural South and they are out of the game, forever.
It doesn’t make sense to me to have a universal hike in the minimum wage for all states or cities. For example, the minimum wage in New York City is $11 an hour. But that $11 only has the purchasing power of $7.36. Here in Birmingham, Ala., the minimum wage is $7.25, but it has the purchasing power of $8.06.
MIT’s Living Wage Calculator exemplifies the differences in earning thresholds and cost of living indexes from around the country. The Living Wage Calculator provides “cost-adjusted estimates of what workers and their families need to make in order to support a basic living in the communities in which they reside.” The developer of the MIT Living Wage Calculator, Dr. Amy Glasmeier, defines a living wage as “the wage needed to cover basic family expenses plus all relevant taxes.”
By using the Living Wage Calculator, you can determine what you need to make for a living wage in every county in the country. In San Francisco County, Calif., it’s $14.37 an hour to achieve a basic living for one adult. The minimum wage in California is $10.50 an hour.
Third Way, described by The Wall Street Journal as a “center-left think tank” and by The New York Times as “radical centrists” and “incorrigible pragmatists,” has taken MIT’s Living Wage Calculator further. Third Way proposes establishing five different minimum wage hikes based on the cost of living in metros. Third Way calls their plan “a regional minimum wage.”
Third Way policy adviser Joon Suh writes on the think tank’s website and in the story titled, “Doing the Right Thing, the Right Way: A Regional Minimum Wage,” what he believes is a fair way to go about raising the minimum wage.
Third Way proposes to replace the single federal minimum wage with a regional minimum wage with readjustments every three years. The think tank believes that the new wage would range from $9.30 per hour in low cost regions to $11.90 per hour in high cost areas. That would set the median federal minimum wage at $10.60 per hour, about where the political centrists believe it should be.
It’s my view that five regional federal minimum wage floors are not enough. Some small manufacturers in rural areas of the South would get hammered by a $2-an-hour hike in the minimum wage, particularly in areas like the Mississippi River Delta and Appalachia.
And the data says: As written, one cannot form a black-and-white, data-centric answer to raising the federal minimum wage. Yet, using MIT’s Living Wage Calculator to set the federal minimum wage is certainly a start to one of the most important aspects of our economy.
“The employment rate is not real.” “The real unemployment rate could be 20 percent or more.” Source: Statements made by Treasury Secretary Steve Mnuchin and President Donald Trump
Both Treasury Secretary Steven Mnuchin and President Donald Trump think the Bureau of Labor Statistics cooks the books when it comes to the monthly unemployment report it publishes each month. Both men totally refuse to believe that the nation’s unemployment rate is 4.7 percent. With 95 million Americans over the age of 15 without a job or not looking for one, surely the unemployment rate cannot be as low as 4.7 percent. There are only 325.5 million people in the country.
As mentioned in the workforce participation section of this story, those outside the labor force can be current high school and college students, stay-at-home parents, prisoners, the disabled and retirees. At a workforce participation rate of 63 percent today, down from 66 percent prior to the Great Recession, the U.S. labor force is the smallest it’s been since the 1970s when the participation rate was as low as 60 percent.
Is the 63 percent workforce participation rate a sign of a weak economy and fewer available jobs, or are demographic factors such as retiring baby boomers to blame? To answer that, let’s look at current statistics. There have been over 5 million jobs available in this country for years. If there is a large block of available labor out there, why aren’t those jobs being filled?
Companies large and small are having a tough time filling positions, many times because the skills needed for those positions can’t be found in the labor shed. Again, if there are so many people in this country who can’t find jobs, then why are 5 million jobs seemingly always available to those people?
There are many announced job-generating projects on hold this very minute because labor is not available in certain areas of the South. For example, several large petrochemical plants in Louisiana and Texas are being delayed because of a lack of construction labor. These projects are waiting on other companies to finish a project, freeing up labor. Construction jobs are considered temporary, but not in the petrochemical industry in Louisiana and Texas. Welders, for instance, will finish up at one plant then start on a new project that may have been delayed for up to a year because there was no available labor, or specifically, no available welders.
Let’s see what driving up the workforce participation rate would do for labor in this country. At no time since 1970 has there been a workforce participation rate that was higher than 67.3 percent. That high mark was set in 2000. Today’s rate is 63 percent, so a difference of 4.3 percent. So, if we met the highest workforce participation rate seen since 1970 today, that would mean an additional 4.4 million workers. That’s not many, and wouldn’t even fill the 5.5 million available jobs that are out there now.
The fact is, since 1970, there has always been between 33 to 40 percent of the workforce over 15 years of age that does not work or does not look for work. So the facts point really to demographics. The sad truth is, this nation is getting older and its population growth is the lowest it has been since the Great Depression.
There is still some slack in the labor market, but it isn’t nearly what President Trump and Treasury Sec. Steven Mnuchin believe. The fact that there were 235,000 jobs created in February proves there is still labor slack. It was interesting that President Trump, who has said that the monthly Bureau of Labor Statistics jobs report is “one of the biggest hoaxes in American politics,” took credit for the great February jobs report. He also said about the February jobs report, the first while in office, “I think it’s going to continue big league.”
So, yes, the demographics indicate that this year and next we could still see some months of 200,000-plus job gains, but those months are dwindling. With a 4.7 percent unemployment rate, we are nearing full employment and that has been supported by the Federal Reserve. Add that to the fact that this administration could deport millions of undocumented people and slow immigration, we could soon be in a situation where we have a shortage of unskilled labor, not just skilled labor.
But all of that pales in comparison to these demographic figures. . .as written, this nation is aging, but at the same time, the U.S. fertility rate fell last year to its lowest rate since the government began keeping track in 1909. The general fertility rate is the average number of births from 1,000 women ages 15 to 44 years old. In 2016, the fertility rate dropped to 59.8 births per 1,000 women, the lowest ever. In addition to the lowest fertility rate in more than 100 years, the U.S. saw the death rate rise last year for the first time in a decade. According to the Census, the U.S. population in 2016 grew at its lowest rate (0.7 percent) since 1936-1937.
Yes, the demographics have our backs against the wall when it comes to the current and future labor force. Of course, the wild card is how many jobs over the next decade or even longer will be replaced by automation. If it is in the millions, the current and future labor shortage will take care of itself.
In the meantime, not factoring in job losses to automation (because I am not sure anyone can put a finger on that number at this point), the labor force is shrinking and fast. The fact of the matter is the growth of the working age population (between 16 and 65) is slowing dramatically. Demographic math is cutting into our available workforce.
For example, from the 1970s to the 1990s, the economists’ standard for job growth in this country was 150,000 jobs created per month. Above 150,000 jobs created per month and the jobless rate would drop, and anything below 150,000 jobs created per month caused the jobless rate to go up.
From the 1970s to the late 1990s, the working age group of 16 to 64 years was growing on average nationally of about 200,000 people a month. The working age population rose by just 71,000 per month over the past two years. And the Census Bureau reported in the fall quarter that the working age population will grow by an average of just 50,000 per month over the next 15 years, which is alarming.
So, 20 years ago, 200,000 people became work eligible each month, but now only 71,000 per month become work eligible in this country. That does not mean the economy is doing poorly. It just means we are seeing less and less people enter employment age.
Today, you can throw away that standard number of needing to create 150,000 new jobs per month. To absorb the current slower growing population, we only need to create about 50,000 jobs per month to sustain a healthy economy. And in a few years, that will drop to 33,000 new jobs per month.
President Trump has set some big goals for the economy. He has promised to create 25 million jobs over 10 years. That’s more than double what has been created under Obama and more than Ronald Reagan or Bill Clinton’s terms. But where will that labor come from? It apparently won’t come from immigrants, and if he deports large numbers of people living in this country, we will see reductions in an already tight labor market.
And the data says: There will always be anywhere from 33 to 40 percent of the workforce that is not participating, unless governments end social, poverty and disability assistance. The U3 unemployment rate is 4.7 percent and the U6 is 9.4 percent. There is no measure that we can find that indicates the true unemployment rate is 20 percent or higher. If anything, we are at or near full employment. And the demographics indicate clearly that the number of people entering the labor force will be at historic lows for many years to come.
The demographics also indicate that creating 25 million jobs over the next 10 years is simply impossible, given the lack of growth in our population. The only way to enlarge the labor force over the next decade or so would be to increase immigration from the current 1 million a year to around 3 million a year, and that is not going to happen. Or, perhaps automation could free up millions of needed workers, but that remains to be seen.